Diagrams and Charts
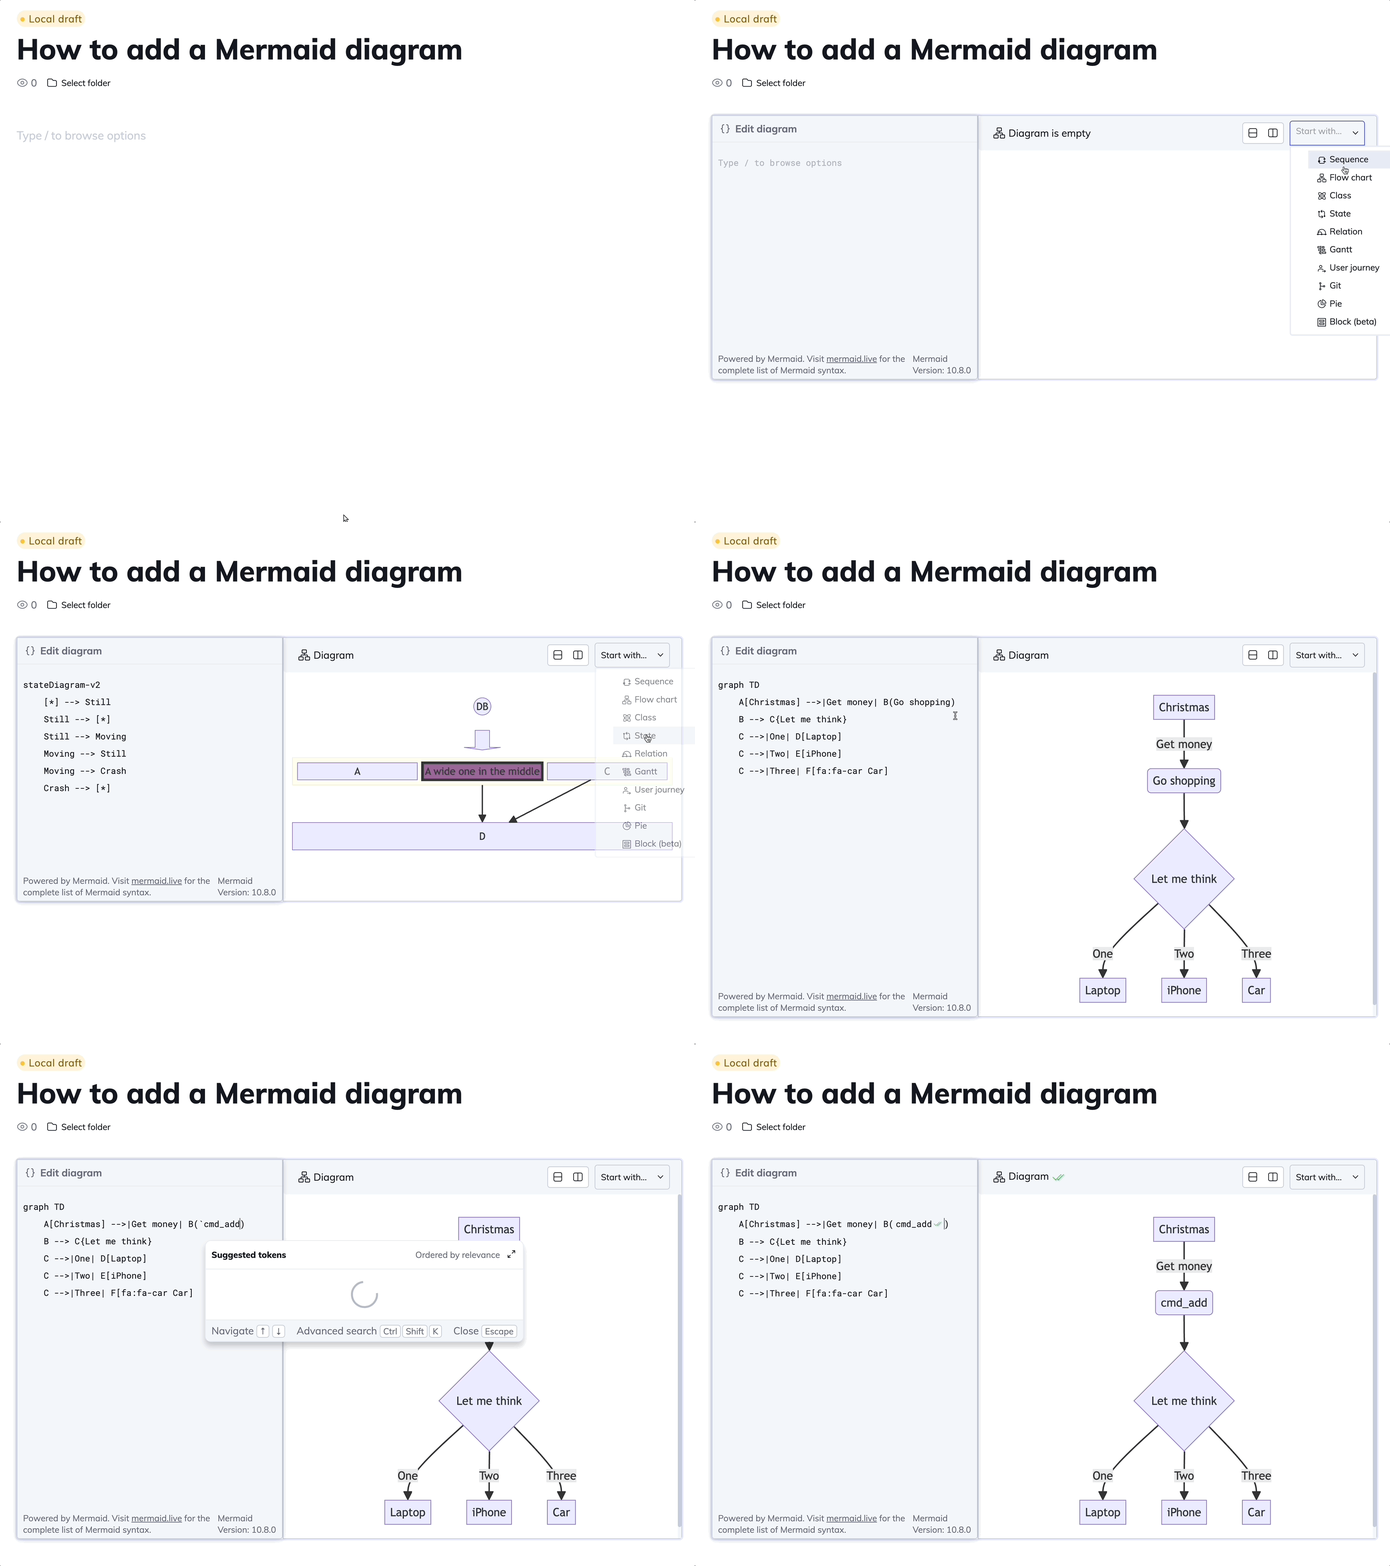
You can create diagrams and charts in your Swimm doc using Mermaid syntax in the editor.
Mermaid + Swimm = up-to-date diagrams 🤯
To get started, type /Diagram to start from scratch or select one of our Mermaid templates.
Get started with a template
| Diagram | Description |
|---|---|
Sequence | Track object interactions and events sequentially for processes or use cases. |
Flowchart | Map steps and decisions to show process flow and outcomes. |
Class | Detail a system's structure with classes, attributes, methods, and their interrelationships. |
State | Monitor object states and their transitions throughout a process. |
Relation | Connect entities or database tables to visualize their relationships. |
Gantt | Schedule and track project tasks, durations, and dependencies over time. |
User journey | Chart a user's path to accomplish tasks within a system or service. |
Git | Trace the history of a Git repository with visual representations of branches and commits. |
Pie | Segment data proportionally to illustrate parts of a whole in a circular graph. |
Block | Sketch high-level system design or architecture using blocks for components or modules. |

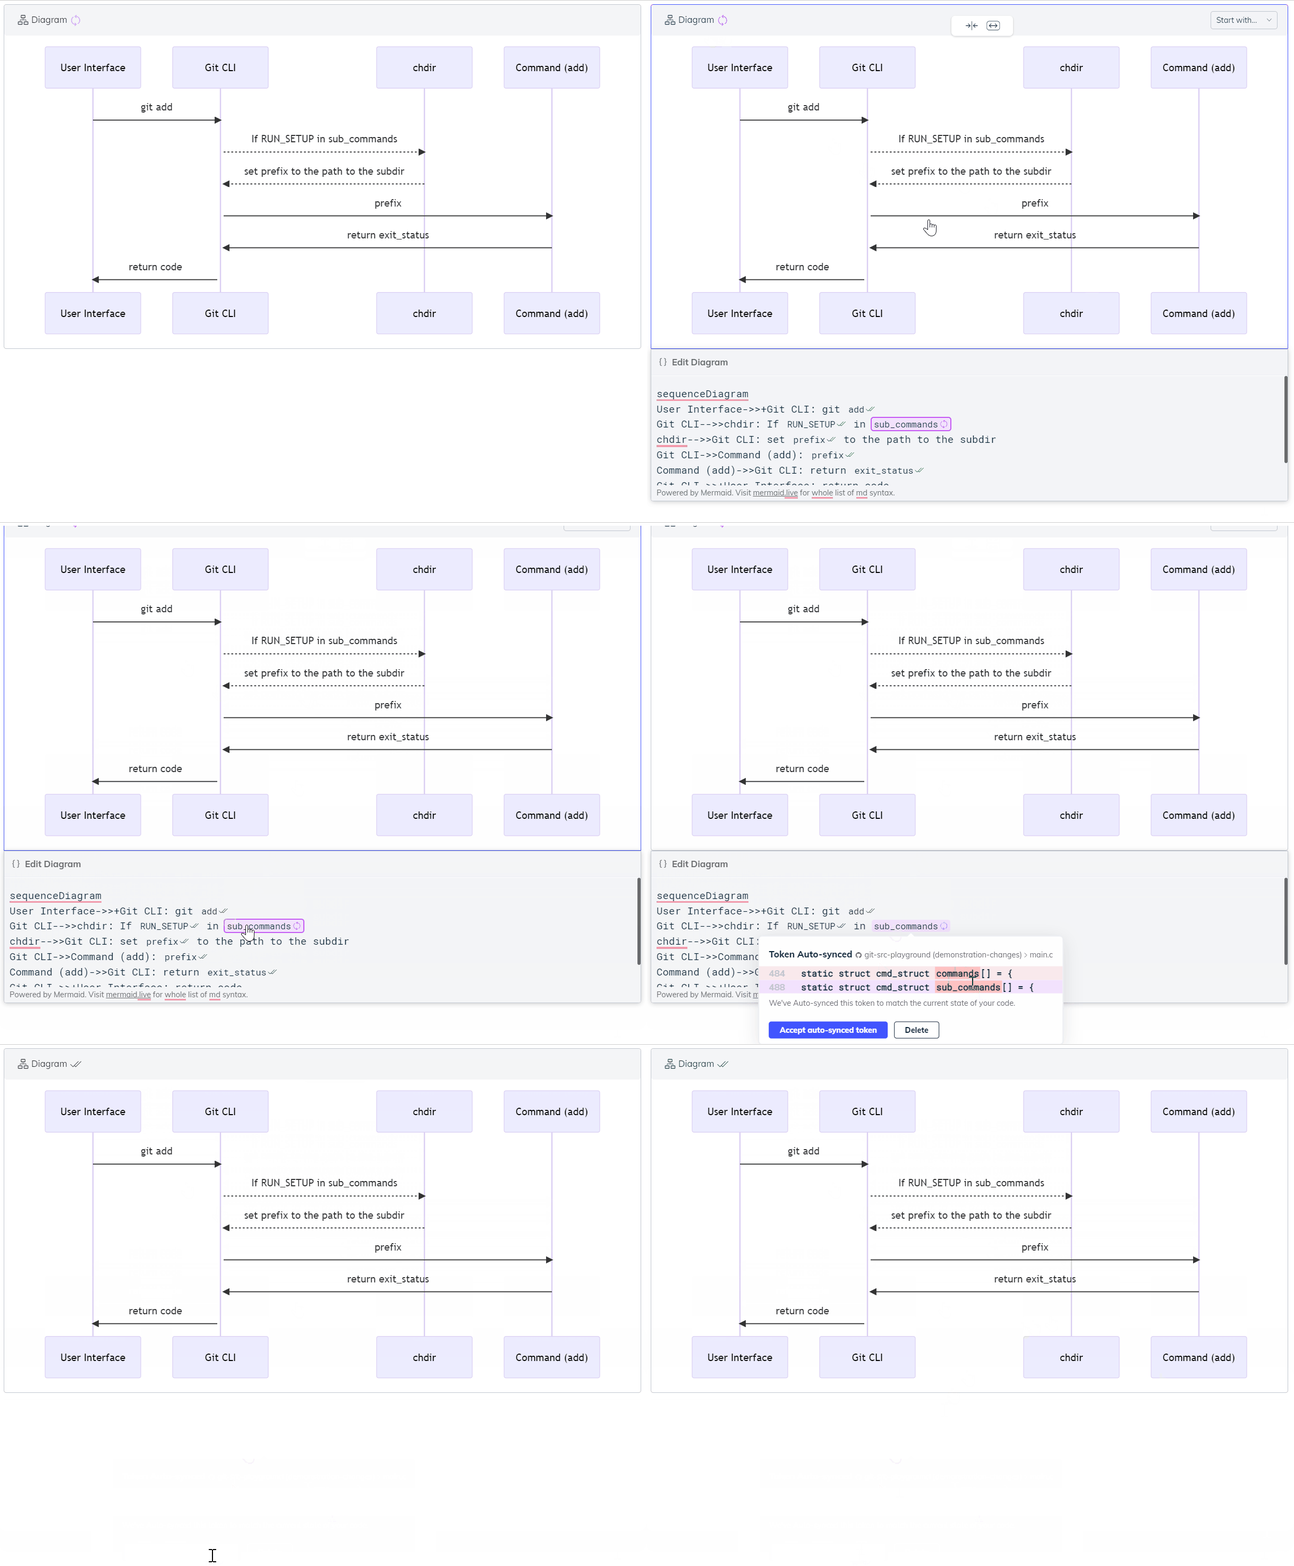
Use Smart Tokens to keep your diagrams up-to-date
Increase the value and reliability of your diagrams with Swimm’s Smart Tokens.
Initialize a token by typing backtick ` or /Smart Token within your diagram labels to code-couple constants or variables.
Now that your Smart token has been added to your diagram, your diagram will stay up-to-date when you refactor your code. 🤯

Learn more
To find out more about Swimm's integration with Mermaid, and different use cases for diagrams in code documentation, see our blog post.
Looking for additional Mermaid resources? Check out Mermaid's docs and this Mermaid live editor.
This document is automatically kept up to date using Swimm.